

The Marina Software Buyer's Guide

What It Shows You
Reporting, visibility, and turning data you can see into decisions you can make
"We have great reporting" is the most common thing a marina software vendor will tell you, and the hardest claim to check. This dimension is about cutting through that phrase: what reporting actually means, the questions most buyers forget to ask, and why being able to see your marina clearly is the foundation for charging what it's worth.
The emptiest claim in the demo
Every vendor claims great reporting. It costs nothing to say, it's nearly impossible to disprove in a polished demo, and it means something different in every product. That makes it the emptiest sentence in the whole sales conversation, and the one buyers most often take at face value.
Behind those two words sits a huge range. "Reporting" might be a dozen fixed PDFs the vendor designed and you can't change. It might be a live dashboard you can slice any way you need. It might be a clean pipe into your own business intelligence tool. Same claim, completely different capability.
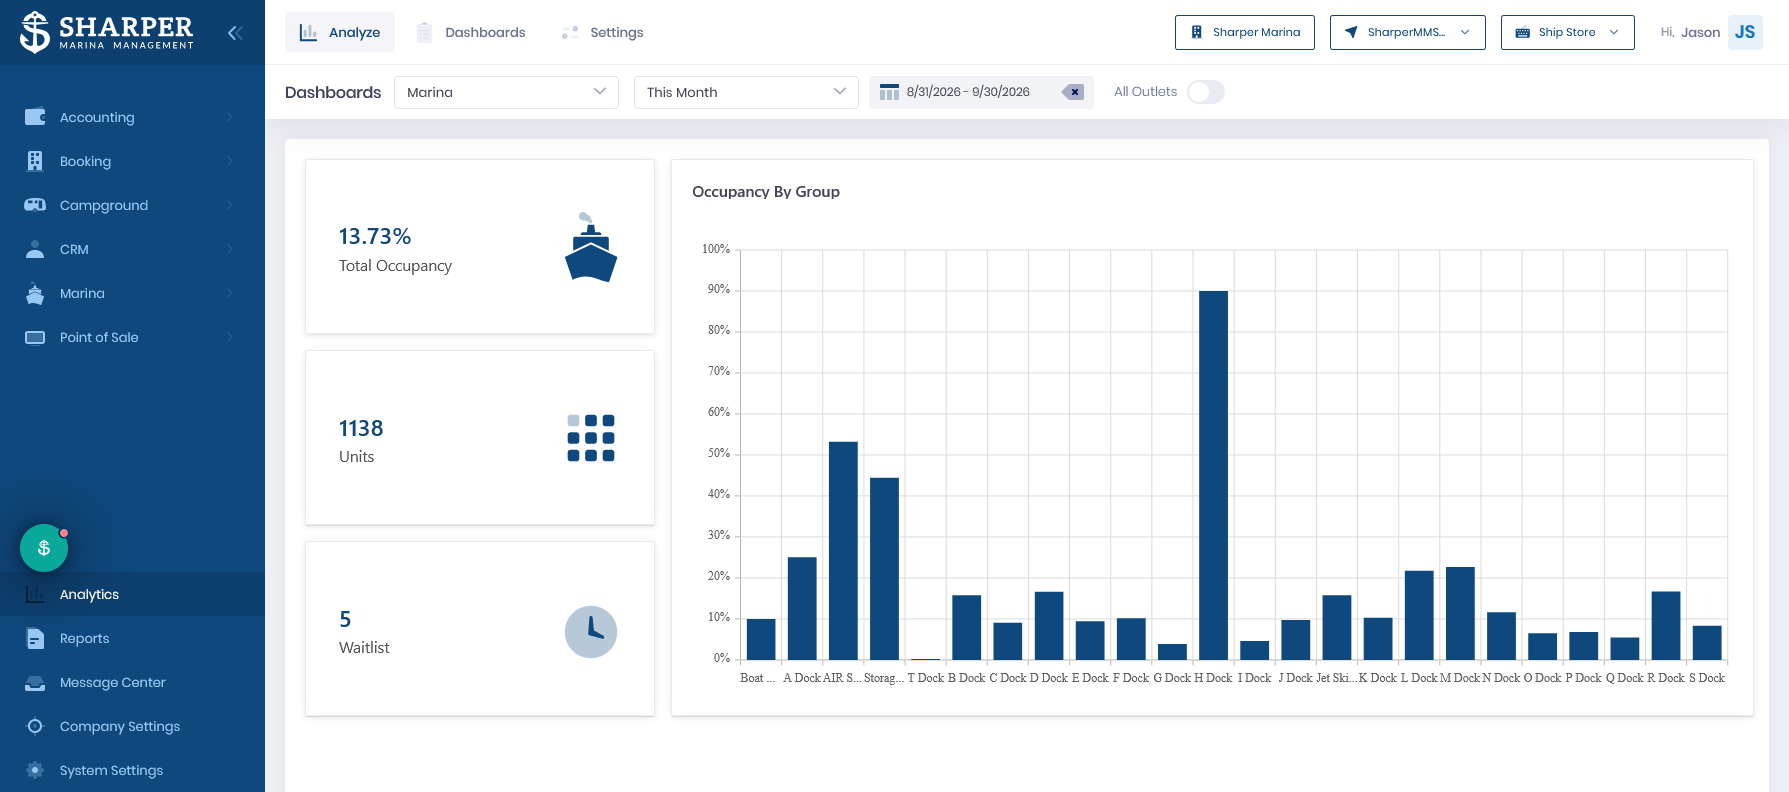
Every vendor has "great reporting." The only question that matters is whether it answers your questions or just theirs.
So the work of this chapter is to make "great" specific enough to test, and then to test it.
What "reporting" actually means
Reporting capability runs along a spectrum. The pretty dashboard in the demo tells you almost nothing about where on it a given product actually sits, so know the levels before you watch.
| Level | What it is | When it's enough |
|---|---|---|
| Built-in reports | A fixed set the vendor designed. You run them, you don't change them. | Fine when their questions happen to be your questions. Useless the moment they aren't. |
| Custom and ad-hoc | You build your own views: filter, group, and save reports the vendor never anticipated. | When your questions change with the season, or you ask things off the beaten path. |
| BI integration | A clean export or live connection into a tool like Power BI, alongside the rest of your business data. | When you already run on a BI tool, or you need marina data in the same place as everything else. |
| Real-time vs batch | A live view of right now, versus last night's snapshot. | Real-time matters for occupancy and receivables decisions you make during the day, not the next morning. |
Most buyers see a polished canned dashboard and assume they're getting the top of this list. Confirm where the product actually sits, because the gap between "we have a dashboard" and "you can answer your own questions" is where most disappointment lives.
The questions buyers forget to ask
The antidote to "great reporting" is specificity. Walk into the demo with the actual questions you need answered and make the software answer them in front of you.
- "Show me the report that answers [a question you ask every month], live, with data like mine."
- "Build me a report you haven't already pre-built. I'll give you the question."
- "Export this to Excel, and to my BI tool. Let me see the raw structure."
- "Is this dashboard real-time, or last night's batch?"
And ask for a few sample reports to take away and study after the demo, when nobody's steering your attention.
How the vendor handles "build me one you didn't prepare" is the whole tell:
Only ever shows the same polished samples. Can't build a new report live. Export is PDF only. Custom reporting is "on the roadmap."
Hands you the report builder, answers a question they didn't prepare for, and exports clean, structured data you can take anywhere.
Reporting across properties
If you run more than one property, reporting isn't just a dimension, it's often the dimension that decides whether you have a portfolio or a pile of separate marinas. The difference comes down to whether the data rolls up.
- Portfolio rollups. Every property in one view, with the ability to drill into any single marina, and compare them side by side on occupancy, revenue, and receivables.
- BI depth. If you live in Power BI or a data warehouse, the quality of the connector matters more than the built-in dashboards. Ask about the enterprise tier specifically.
- Role-based access. Each site manager sees their property; you see all of them. Without this, central oversight means central data entry.
"Reporting is per-property, you just log into each site separately." That's not a portfolio view, it's the manual consolidation you're trying to escape, with extra logins. For a multi-site operator, this one answer can rule a vendor out.
Chapter 8 covers the BI and integration tooling behind this, and Chapter 22 builds the full multi-site readiness picture on top of this portfolio-reporting foundation.
Visibility is a pricing lever
Reporting is usually sold as operational hygiene: know your occupancy, watch your receivables, keep the lights on. That undersells it. Clear visibility is the foundation of pricing, and pricing is where the real money in a marina is won or lost.
You cannot price what you cannot see. An operator who can see transient demand by weekend, occupancy by slip type, and which prime slips sit empty can act on all of it: dynamic transient rates, a premium on the best slips, holiday pricing that reflects holiday demand. An operator flying on last month's spreadsheet charges one flat rate and hopes.
Don't accept "great reporting." Test whether it answers your questions, exports your data cleanly, rolls your properties into one view, and shows you enough to price on. The operators who can see clearly are the ones who can charge differently. That, not the dashboard, is what this dimension is really worth.
Reporting depth often comes down to what the software connects to, which is the next dimension. Chapter 8 takes on integrations and the ecosystem, including the BI tooling that powers the reporting you just learned to test.
What it connects to: the integration ecosystem
The fourth dimension. Whether the software talks to the other systems you depend on, and how to judge integration quality instead of just integration count.
Read Chapter 8 →References and further reading
- Sharper MMS, Map the Switch Migration Assessment
- Association of Marina Industries (AMI), industry research and benchmark data. marinaassociation.org
- Storable Marine, AMI, and Marina Dock Age, Navigating the Numbers: 2026 Marina Operator Insights & Technology Automation